In Oracle APEX, adding tooltip information to a map enhances user interaction by displaying contextual details when users hover over map markers. Tooltips can show any relevant data—such as location names, descriptions, or statistics—pulled from your underlying SQL query. By configuring the Map region’s tooltip settings, you create a more informative and engaging geographic visualization without cluttering the map itself.
To add tooltip information to a Map region in Oracle APEX, follow these detailed steps:
-
Prepare Your Data
Ensure your SQL query returns at least these columns: latitude, longitude, and the text you want in the tooltip (for example,LOCATION_NAME,DESCRIPTION, or a concatenation of fields). -
Create or Edit the Map Region
In Page Designer, locate the region you want to use as a map or create a new region of type Map. -
Configure the Data Source
Under the Map region’s Source section:
• Set Type to SQL Query.
• Enter a query such as:SELECT latitude AS lat, longitude AS lon, location_name || ' (' || city || ')' AS tooltip_text FROM my_locationsHere,
tooltip_textcombines columns into the value you’ll display in the tooltip. -
Define the Map Layer
Under Layer settings:
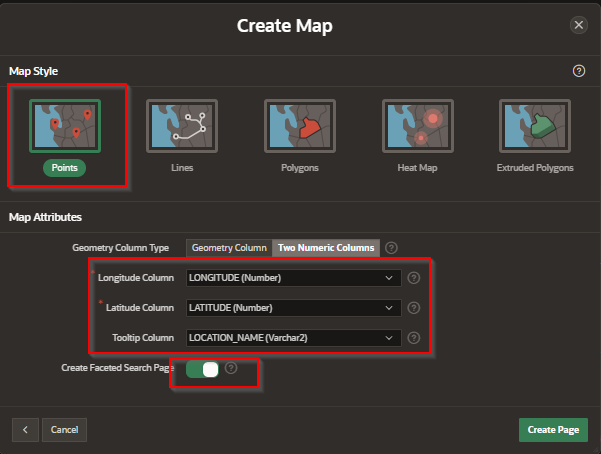
• Set Layer Type to Point.
• Set Latitude Column toLAT.
• Set Longitude Column toLON.
• Set Tooltip Column toTOOLTIP_TEXT. -
Customize Tooltip Display (Optional)
If you need HTML formatting or multiple lines:
• Under Tooltip Column, choose HTML Expression instead of a column name.
• Enter an expression like:'<div><strong>' || location_name || '</strong><br/>' || 'Population: ' || TO_CHAR(population, '999,999') || '</div>'This will render bold labels and line breaks in your tooltip.
-
Adjust Map Attributes
Under Attributes:
• Choose your Map Provider (Oracle Map or Google).
• Set initial Zoom Level and Center coordinates.
• Enable Marker Cluster, Heat Map, or other layers as needed. -
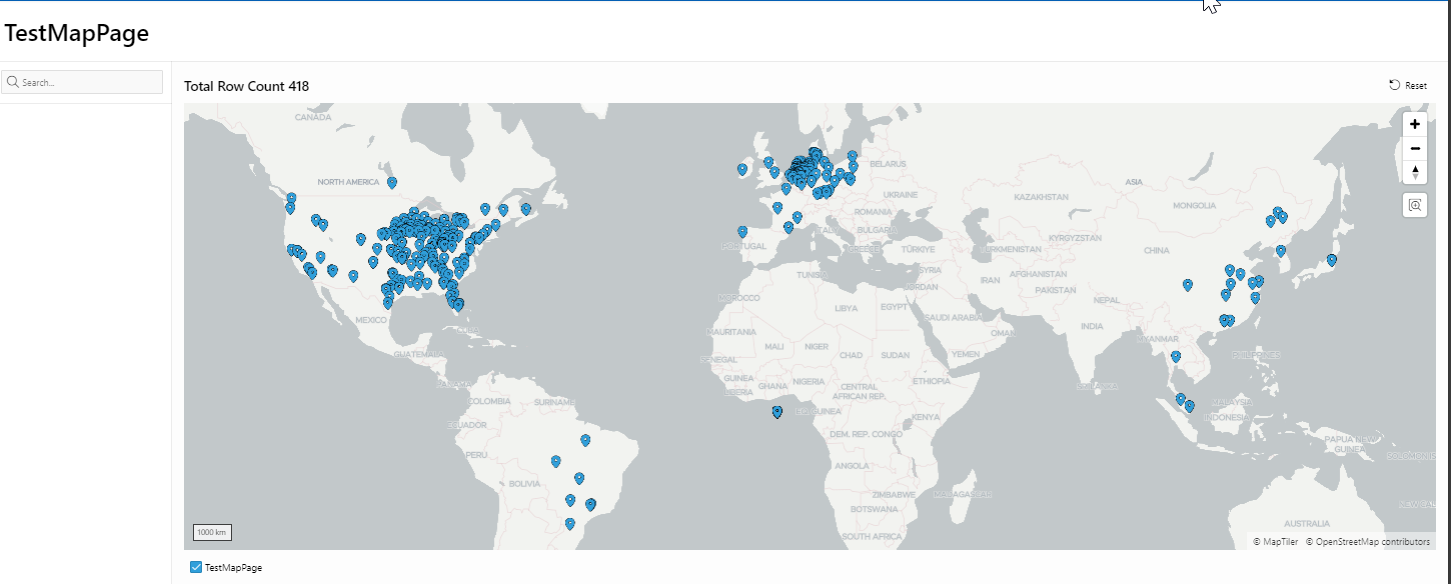
Preview and Test
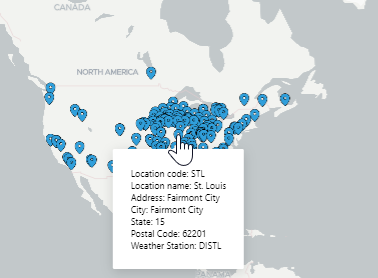
Run the page and hover over the map markers. The tooltip should appear, displaying the text or HTML you defined.
By mapping a dedicated tooltip column (or HTML expression) to your Map layer, you provide users with rich, on‑hover information that enhances the utility and interactivity of your geographic visualization.
Adding a Tooltip to a Map Faceted Report in Oracle APEX
A Map Faceted Report in Oracle APEX provides users with an interactive way to visualize data based on geographic locations while allowing them to refine results using facets. Adding a tooltip enhances the user experience by displaying additional details when they hover over map points, allowing them to get more information without clicking or navigating away.
Why Use Tooltips in a Map Faceted Report?
Tooltips provide an efficient way to show extra details about a location without cluttering the interface. They allow users to quickly understand key attributes of a map point, such as address, population, revenue, or other relevant information.
Steps to Add a Tooltip to a Map Faceted Report
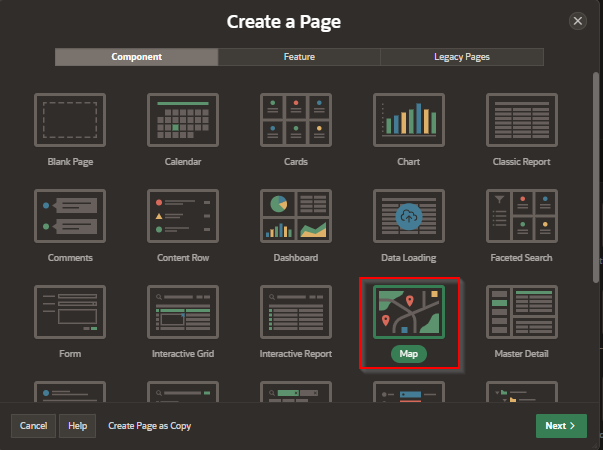
Step 1: Create a Map Faceted Report
Open App Builder in Oracle APEX and navigate to your application.
Click Create Page and select Faceted Search under the Report section.
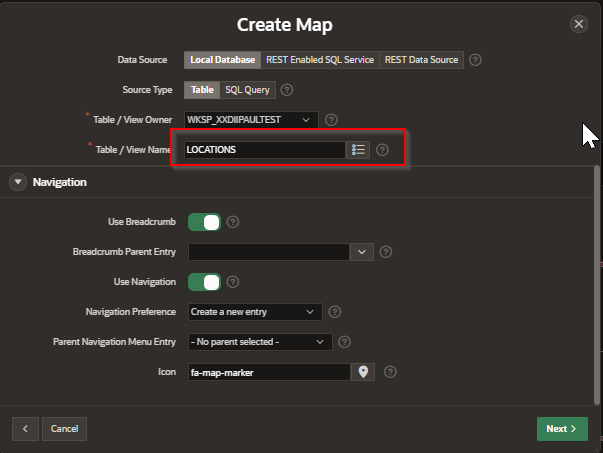
Choose a table or SQL query containing location-based data (such as latitude and longitude).
Click Next, set up the page attributes, and click Create.
Once the report is created, go to Page Designer and locate the Map Report Region.
Step 2: Enable Tooltips for Map Points
Select the Map Region in Page Designer.
Open the Attributes section and find the Tooltip settings.
In the Tooltip Column option, choose the column that contains the text you want to display in the tooltip.
If no tooltip column exists in the dataset, create a custom SQL Query to concatenate necessary information:
SELECT location_name, latitude, longitude,
'Address: ' || address || '<br>Population: ' || population AS tooltip_info
FROM locations_table;
Save the changes and run the report. Now, hovering over a map point will display the information from the selected tooltip column.
Step 3: Customize the Tooltip Appearance Using CSS
APEX allows styling tooltips using CSS to improve readability.
Navigate to Shared Components → Themes → CSS.
Add the following CSS code to customize tooltip appearance:
.apex-map-tooltip {
background-color: rgba(0, 0, 0, 0.8);
color: white;
padding: 8px;
border-radius: 5px;
font-size: 12px;
}
Save the CSS changes and refresh the page to see the customized tooltip.
Step 4: Enhancing Tooltips with JavaScript for Dynamic Content
To further enhance tooltips, use JavaScript to display dynamic content:
Open Page Designer and select the Map Region.
In the JavaScript section, add a dynamic action triggered on Mouse Over for map points.
Add the following JavaScript to format and enhance tooltips dynamically:
function customizeTooltip(mapPoint) {
return `<b>${mapPoint.location_name}</b><br>
Address: ${mapPoint.address}<br>
Population: ${mapPoint.population}`;
}
apex.region("map_region_static_id").widget().on("mouseover", ".a-map-point", function(event) {
let tooltipContent = customizeTooltip(event.data);
apex.tooltip.show(event.target, tooltipContent);
});
Save the changes and test the tooltip behavior.
Best Practices for Tooltips in Map Faceted Reports
Keep tooltip text concise to avoid overwhelming users.
Use HTML formatting to make the tooltip content more readable.
Ensure tooltips contain relevant and useful information based on the use case.
Optimize the dataset query to avoid performance issues when rendering tooltips.
Test tooltips on different devices to ensure usability across various screen sizes.
Adding tooltips to a Map Faceted Report in Oracle APEX enhances the user experience by providing contextual information without requiring extra clicks. Using APEX’s built-in tooltip options, custom CSS styling, and JavaScript enhancements, developers can create visually appealing and informative tooltips that improve usability and data exploration.
EXAMPLE:
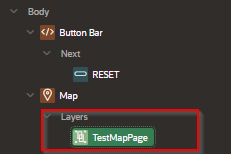
Step 1 – click on the Layer that you’re wanting to use for the tip placement.
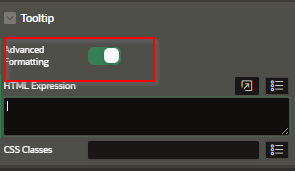
Step 2- Select the Tool Tip area and switch to “Advanced Formatting”.
Step 3 – Add the HTML and table tags to display the data
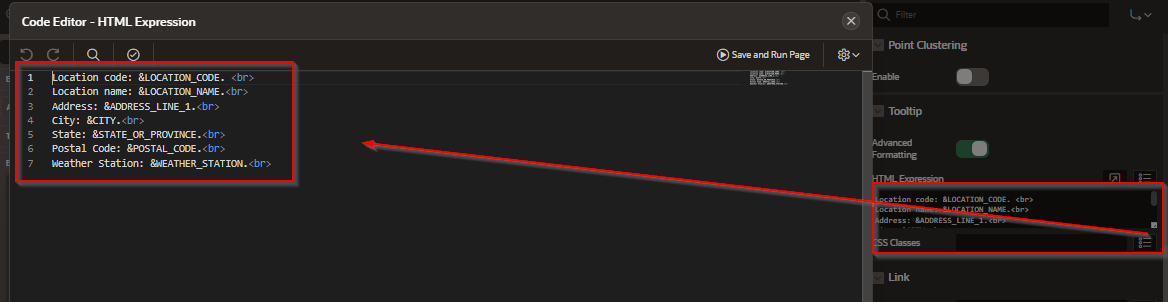
Here is the code:
Location code: &LOCATION_CODE. <br>
Location name: &LOCATION_NAME.<br>
Address: &ADDRESS_LINE_1.<br>
City: &CITY.<br>
State: &STATE_OR_PROVINCE.<br>
Postal Code: &POSTAL_CODE.<br>
Weather Station: &WEATHER_STATION.<br>
Notice that:
Table column names are ALL upper case
Table column names start with a “&” and end with a period “.”
You can mix HTML and the column names to generate the tool tip.
Save and preview
To implement tooltips, ensure your SQL query returns the fields you want to display (for example, lat, lon, and location_name). In Page Designer, edit your Map region’s Layer attributes and set the Tooltip Column to the column containing your descriptive text. You can further customize the tooltip format by specifying HTML expressions, combining multiple columns, or adding conditional logic. Once configured, tooltips appear instantly on hover, providing users with rich information at a glance and making your map reports both interactive and user‑friendly.